In the 'Index of Eight Core Industries', which one of the following is given the highest weight?
Contents18
- ACoal production
- BElectricity generation
- CFertilizer production
- DSteel production
Show answer
Answer: (B) Electricity generation
The Index of Eight Core Industries tracks production in 8 key sectors that form the backbone of the economy.
As per the Economic Survey Appendix (A-42), these 8 sectors and their approximate weights are:
- Petroleum Refinery Products (28.04%)
- Electricity (19.85%)
- Steel (17.92%)
- Coal (10.33%)
- Crude Oil (8.98%)
- Natural Gas (6.88%)
- Cement (5.37%)
- Fertilizers (2.63%).
Together, these core industries account for about 40.27% of the Index of Industrial Production (IIP).
Among the options given — Coal (10.3%), Electricity (19.85%), Fertilizer (2.63%), and Steel (17.92%) — Electricity has the highest weight at nearly 20%.
This is a factual/data-based question.
Tip: You do not need to memorize all weights, but remember the top 3 in order — Refinery > Electricity > Steel — and that Fertilizer has the lowest weight.
The Index of Eight Core Industries measures production in 8 sectors that together account for about 40% of India's total industrial production, making it a key economic indicator.
The top 3 sectors by weight are always Petroleum Refinery Products (highest at around 28%), followed by Electricity (around 20%), then Steel (around 18%), while Fertilizers has the lowest weight at under 3%.
Index of Eight Core Industries
Indian Economy Index of Eight Core Industries highest weight
Index of Eight Core Industries: Composition & Weights
Top 3 by weight: Petroleum Refinery Products > Electricity > Steel
Electricity has the highest weight among the 4 options at 19.85%
Core industries account for 40.27% of total IIP
Fertilizers have the lowest weight at 2.63%
What It Measures
The Index of Eight Core Industries tracks monthly production performance in 8 critical sectors that form the backbone of India's economy. Released by the Ministry of Commerce & Industry, this index serves as a leading indicator for the broader Index of Industrial Production (IIP).
Eight Core Industries & Weights
Industry | Weight (%) | Rank | Key Role |
|---|---|---|---|
Petroleum Refinery Products | 28.04 | 1 | Energy supply, transport fuel |
Electricity | 19.85 | 2 | Power for all sectors |
Steel | 17.92 | 3 | Infrastructure, construction |
Coal | 10.33 | 4 | Primary energy source |
Crude Oil | 8.98 | 5 | Raw material for refining |
Natural Gas | 6.88 | 6 | Clean energy, fertilizers |
Cement | 5.37 | 7 | Construction, infrastructure |
Fertilizers | 2.63 | 8 | Agricultural inputs |
Question Analysis
Among the 4 options, Electricity (19.85%) beats Coal (10.33%), Steel (17.92%), and Fertilizer (2.63%)
The question tests factual knowledge of sectoral weights, not conceptual understanding
Memory aid: REP dominates → Refinery, Electricity, Petroleum (though Steel comes 3rd, not Petroleum)
Trap: Assuming Steel has highest weight because it's a major industry — Electricity actually ranks higher
Trap: Confusing this with IIP weights where manufacturing dominates — Core Industries use different weights
Trap: Thinking Coal leads because it's India's primary energy source — Refined petroleum products have higher economic value
Memory error: Fertilizers consistently have the lowest weight — never pick fertilizers for 'highest' questions
Index of Industrial Production
Indian Economy Index of Industrial Production IIP
Index of Industrial Production (IIP): Structure & Significance
IIP measures monthly industrial performance across Mining, Manufacturing, Electricity
Manufacturing has the highest weight at 77.63% in IIP
Released by Central Statistics Office (CSO) with 6-week lag
Base year: 2011-12 (revised from 2004-05)
Purpose & Coverage
IIP is India's primary measure of industrial sector performance, covering production trends across mining, manufacturing, and electricity generation. It serves as a key input for GDP calculations and economic policy decisions.
IIP Sectoral Composition
Sector | Weight (%) | Sub-categories | Key Industries |
|---|---|---|---|
Manufacturing | 77.63 | 23 industry groups | Textiles, Chemicals, Automobiles, Electronics |
Mining | 14.37 | 6 industry groups | Coal, Iron Ore, Bauxite, Limestone |
Electricity | 7.99 | Single category | Thermal, Hydro, Nuclear, Renewable |
Relationship with Core Industries
Core Industries contribute 40.27% to total IIP weight — they're a subset, not separate
IIP covers 407 items while Core Industries track only 8 sectors
Core Industries data is released earlier (around 12th of month) than full IIP (12th of next month)
Strong correlation: Core Industries growth often predicts IIP direction
Trap: Confusing IIP sectoral weights (Manufacturing 77%) with Core Industries weights (Refinery 28%)
Trap: Thinking Core Industries and IIP are separate indices — Core Industries are part of IIP
Trap: Using old 2004-05 base year — current base is 2011-12
Electricity Sector in India
Indian Economy Electricity generation
India's Electricity Sector: Generation Mix & Policy Framework
Coal-based thermal power dominates India's electricity generation at ~70%
Renewable energy target: 500 GW by 2030
Central Electricity Authority (CEA) monitors power sector statistics
Electricity is in Concurrent List — both Centre and States can legislate
Strategic Importance
Electricity generation receives the 2nd highest weight (19.85%) in Core Industries Index because it's essential for all economic activities. Power availability directly impacts industrial production, making it a critical leading indicator for economic performance.
India's Power Generation Mix
Source | Share (%) | Key Features | Major States |
|---|---|---|---|
Thermal (Coal) | ~70 | Cheapest, high emissions | Chhattisgarh, Jharkhand, Odisha |
Renewable | ~25 | Solar, Wind, growing fast | Rajasthan, Gujarat, Tamil Nadu |
Hydro | ~12 | Clean, seasonal variation | Himachal Pradesh, Uttarakhand |
Nuclear | ~3 | Clean, limited capacity | Maharashtra, Tamil Nadu |
Gas | ~2 | Flexible, expensive fuel | Gujarat, Uttar Pradesh |
Policy Framework
Electricity Act 2003: Comprehensive reform law covering generation, transmission, distribution
Central Electricity Regulatory Commission (CERC): Regulates interstate electricity trade
State Electricity Regulatory Commissions: Regulate intrastate power sector
Power Grid Corporation: Central PSU managing national transmission network
Generation Capacity Distribution
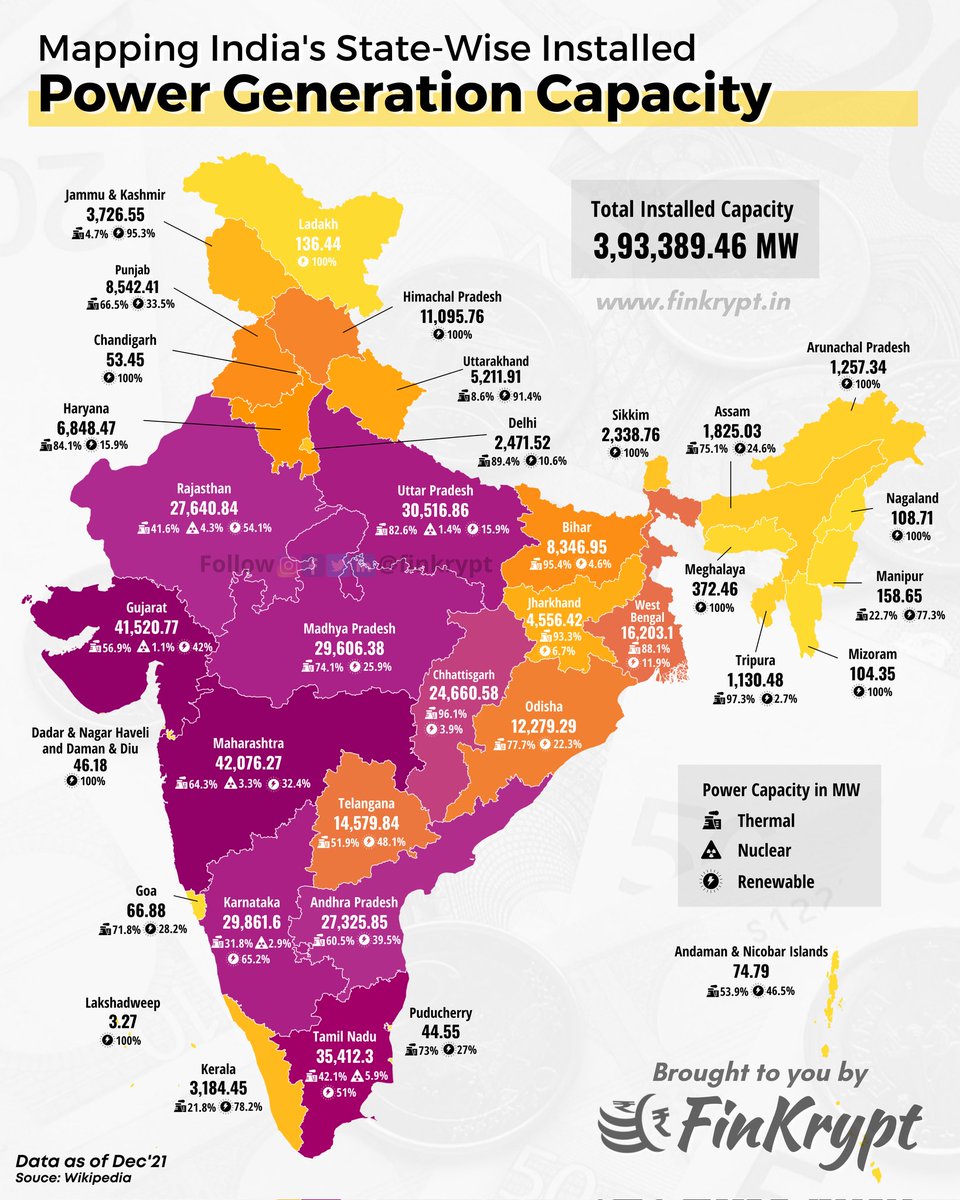
Source: x.com — Today's infographic depicts the installed power capacity in #India ... · x.com
Steel Production in India
Indian Economy Steel production
India's Steel Industry: Production Capacity & Global Position
India is world's 2nd largest steel producer after China
Steel has 17.92% weight in Core Industries Index — 3rd highest
National Steel Policy 2017: Target 300 MT capacity by 2030-31
Odisha leads in steel production due to iron ore reserves
Strategic Significance
Steel production carries high weight (17.92%) in Core Industries because it's a proxy for infrastructure and construction activity. Steel demand reflects economic growth — from railways and highways to automobiles and machinery manufacturing.
Major Steel Producers in India
Company | Ownership | Capacity (MT) | Key Locations |
|---|---|---|---|
Steel Authority of India (SAIL) | Public | ~21 | Bhilai, Bokaro, Durgapur, Rourkela |
Tata Steel | Private | ~19 | Jamshedpur, Kalinganagar |
JSW Steel | Private | ~18 | Vijayanagar, Dolvi |
Jindal Steel & Power | Private | ~15 | Raigarh, Angul |
Rashtriya Ispat Nigam (RINL) | Public | ~7 | Visakhapatnam |
Raw Material Advantage
India has world's 5th largest iron ore reserves — key input for steel production
Coking coal is mostly imported from Australia, USA — major cost component
Steel clusters in Odisha, Jharkhand, Chhattisgarh due to mineral proximity
Finished steel consumption: ~100 kg per capita (vs global average 230 kg) — huge growth potential
Steel Production Centers
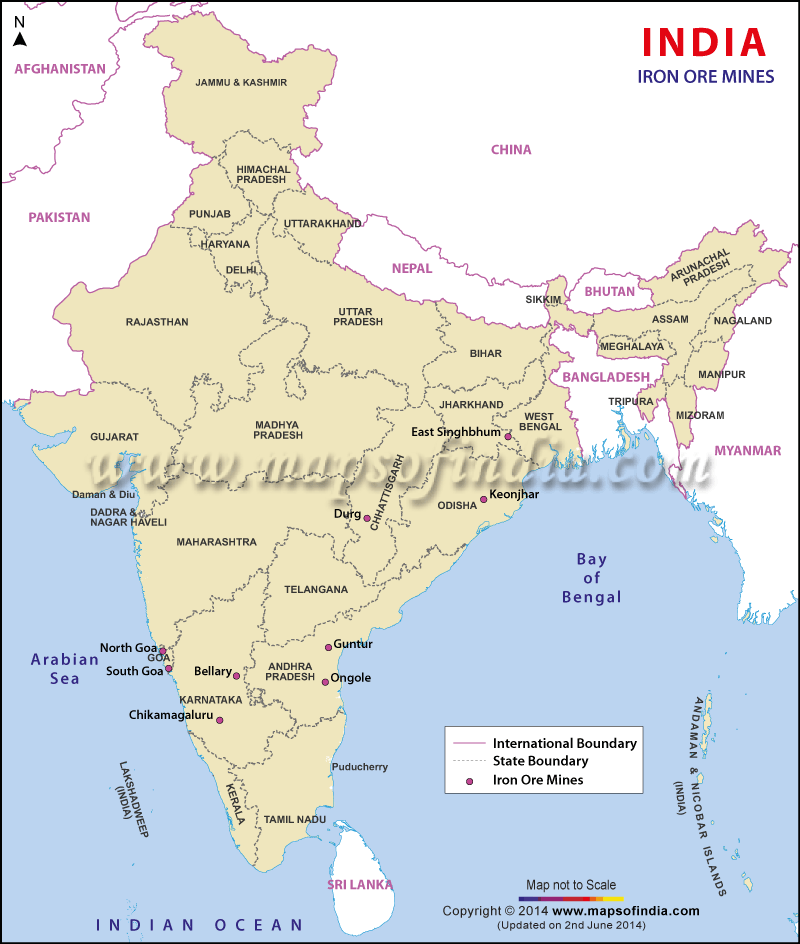
Source: India Map — Iron Ore Mines in India, Iron Ore Mines Map of India · www.mapsofindia.com